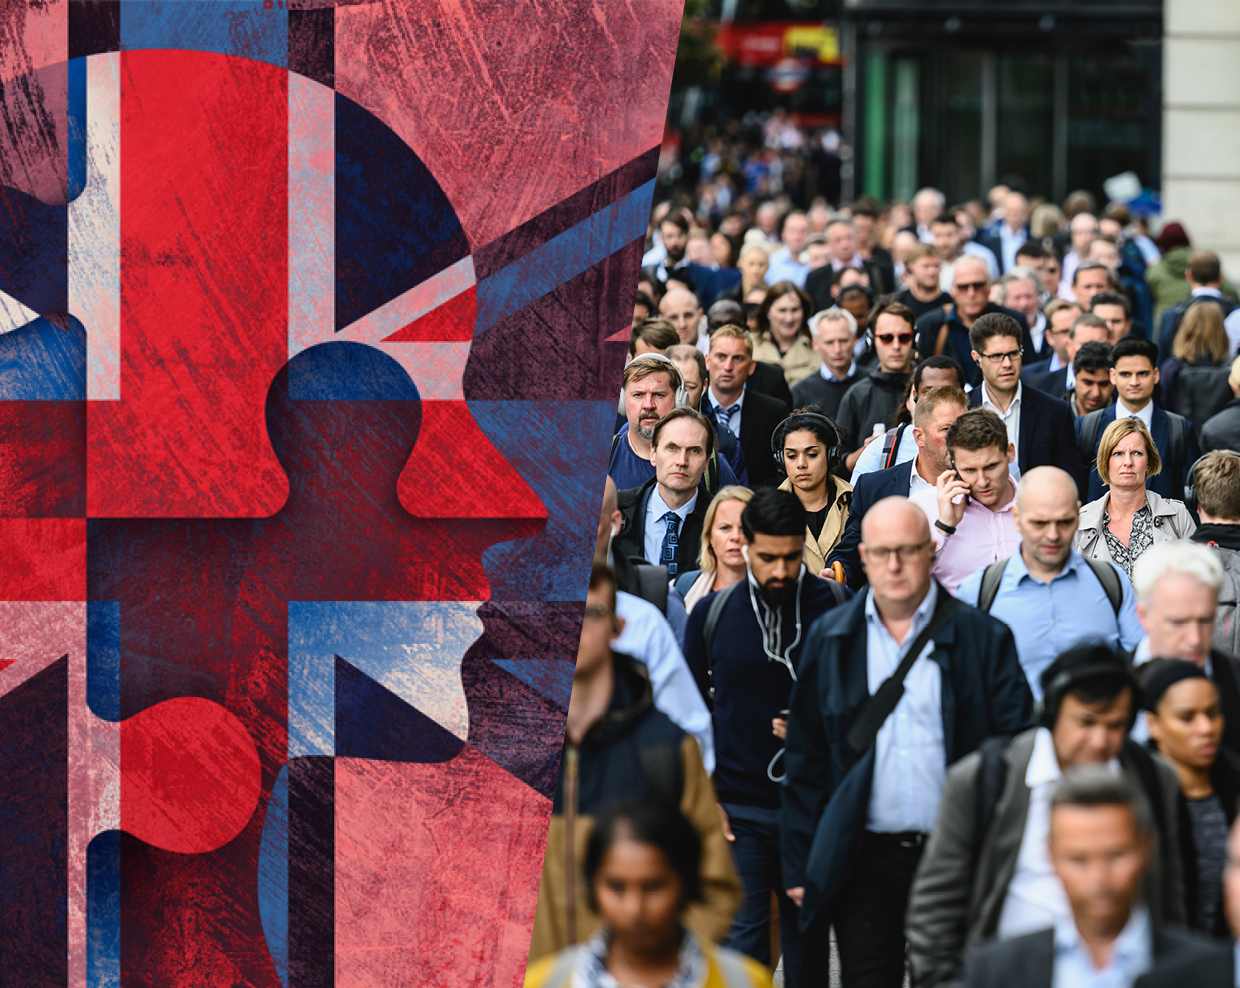
Measuring Poverty 2019 – A report of the Social Metrics Commission

The 2019 report uses the most recent data available to provide a detailed overview of the extent and nature of poverty in the UK, based on the Commission’s measurement framework.

A report for the Social Metrics Commission programme by Baroness Philippa Stroud

Published 29 Jul 2019

The Social Metrics Commission’s 2019 report reveals the scale of the challenge when it comes to tackling poverty across the UK

The Social Metrics Commission was founded in 2016 to develop a new approach to poverty measurement. The ambition was to develop metrics that both better reflected the nature and experiences of poverty that different families in the UK have, and which could be used to build a consensus around poverty measurement and action in the UK.

Since publishing its first report in 2018, the Commission has continued to build support for its approach to poverty measurement. It was pleased to welcome the Government’s announcement that the Department for Work and Pensions would be developing experimental statistics based on the Commission’s measurement approach.

The 2019 report uses the most recent data available to provide a comprehensive account of poverty based on the Commission’s measurement framework. It provides both a detailed overview of the extent and nature of poverty in the UK today and original analysis that shows how this has changed since the first year where the data for the Commission’s measurement framework is available (2000/01).

The report’s key findings are:

  • There are 14.3 million people in poverty in the UK. This includes 8.3 million working-age adults; 4.6 million children; and 1.3 million pension-age adults.
  • This means that, despite fluctuations, overall rates of poverty have changed relatively little since the millennium. The current rate of poverty is 22%, which is the same as last year and only slightly lower than the 24% seen in 2000/01.
  • However, this trend hides significant changes in rates of poverty among different groups. Poverty rates amongst pension-age adults fell steadily from 19% in 2000/01 to 9% in 2014/15, but have since risen slightly to 11%. Similarly, poverty rates among children dropped from 36% in 2000/01 to 31% in 2014/15, but have now risen slightly to 34%.
  • On average, those in poverty have moved closer to the poverty line now than would have been the case in 2000/01. However, a third (31%) of people in poverty – 4.5 million people – are more than 50% below the poverty line, and this proportion has not changed since the millennium.
  • Just under half (49%) of those in poverty – 7 million people – are in persistent poverty, meaning they are in poverty now and have also been in poverty for at least two of the previous three years. Rates of persistent poverty vary significantly by different groups, with 2.3 million children, 1.2 million people living in long-parent families, and 1.8 million of those living in workless households experiencing persistent poverty.
  • Poverty persistence is particularly high for those in deep levels of poverty. Three fifths (59%) of those living more than 50% below the poverty line are also in persistent poverty, compared to just over a third (36%) of those living within 5% of the poverty line.
  • Nearly half (48%) of people in poverty – totalling 6.8 million people – live in a family where someone is disabled.
  • The poverty rate for people living in families where all adults work full time is just 10%, compared to 58% where all adults work part time and 70% in workless families.
  • Poverty rates amongst families from ethnic minorities are particularly high. Nearly half (46%) of people in families with a Black head of household and 37% of people in families with an Asian head of household are in poverty, compared to 19% of people in a family with a White head of household. However, 76% of those in poverty live in families with a head of household who is White.
  • Poverty rates vary across the UK. Compared to the UK average of 22%, poverty rates are higher in Wales (24%) and London (28%) and lower in the South East (18%), Scotland and Northern Ireland (both 20%).

The SMC’s Lived Experience Indicators show that:

  • One in five (18%) people in poverty live in a family where no one has any formal qualifications. This compares to 9% of those not in poverty.
  • One in ten (8%) people in poverty rarely or never feel close to others, compared to 4% of those not in poverty.
  • One in five (21%) people in poverty live in families where adults believe that people in their neighbourhood cannot be trusted. This compares to just 9% of people not in poverty.
  • Over two thirds (69%) of people in poverty live in families where no adult saves, compared to 38% of those in families not in poverty.
  • As the UK’s employment rate has increased, the proportion of working-age adults in poverty who are workless has fallen by nine percentage points since 2000/01 to 52%.
  • Since 2000/01 people in poverty are six percentage points less likely to be in a lone-parent family and three percentage points less likely to be a single pensioner. They are four percentage points more likely to be a single adult.

Read the full report at the Social Metrics Commission website: socialmetricscommission.org.uk

Download

Measuring Poverty 2019 – A report of the Social Metrics Commission:

The Social Metrics Commission’s 2019 report reveals the scale of the challenge when it comes to tackling poverty across the UK

By Baroness Philippa Stroud

Jul 2019

Download the reportPDF